Welcome to PageSpeed.ONE’s Website Speed Tester!
Before diving into our tool, take a quick tour of the features it offers.
The PageSpeed.ONE speed tester assists you in measuring your website's current speed, monitoring changes, evaluating optimization impacts, and provides you with optimization recommendations.
The Essentials
If you’re not delving into the intricacies of speed, remember at least these two perspectives on data – the team dashboard and the Test Summary.
Team Dashboard
This is the central hub for monitoring the status and progress of domain speed. Here you can view speed data from users via Google (Chrome UX Report).
 The main team dashboard can include multiple tests.
🔒 This dashboard is available only to team members or PLUS test users.
The Test Itself
In the test itself, you’ll see a summary of various types of measurements. The most crucial are, of course, the user data from Google for domains:
 The Summary report also shows auxiliary metrics like TTFB (server response) or FCP (first paint).
In the Summary report, you see the state of metrics for different measurements (Chrome UX Report or synthetic), their changes over the last month for mobile or desktop. More on the Summary report.
In the test itself, you can see numerous views on the speed of measured URLs and domains.
For Team Administrators
If you are responsible for team management, you'll be interested in user administration and test settings.
Team Management
Here you can add other colleagues who should view speed data or receive notifications about changes.
 Assign different permissions to team members.
We recommend adding everyone whose work influences speed – developers, marketers, managers.
🔒 Team management is available only in PLUS tests.
Test Settings
In the settings, you can change the measured URLs (we recommend setting the most common entry-type pages here) and also domains (e.g., client subdomains or competitors):
 Adjust the monitored entry pages and domains (yours or competitor's) in the settings.
🔒 In PLUS tests, you can monitor 5 URLs and 5 domains, with more available for an additional fee. The free version allows only 3 URLs and 3 domains.
Speed Monitoring and Change Evaluation
Watchdog
About a week after testing begins, levels for speed monitoring, i.e., the Watchdog are set up, after which the current speed level monitoring begins.
 With the Watchdog, you see daily metric developments like LCP (loading speed).
If a significant metric worsens or improves, you’ll receive a message.
🔒 The Watchdog is part of PLUS tests. More information about the Watchdog.
Speed Watchdog notifications are sent via email. You can also receive them in Slack, Teams, see test settings.
Watchdog notifications should be verified against metric developments in the Domains report.
Pages Report and Specific Test Run Details
If there’s a downturn in the Watchdog, in the Pages report you can find out which specific page type is causing trouble on your site:
 LCP breakdown by pages in the Pages report.
Clicking on a point in the synthetic measurement graph allows access to test run results:
 Lighthouse test results are available, including files for further tuning, such as Trace.
There is a tutorial on Vzhůru dolů, detailing how to use the website speed tester to fine-tune specific issues.
Technical Report
In the Technical report, we display data movement that isn’t primary metrics but can serve to evaluate changes for the better or worse.
 The JS data volume has increased here, which might warrant some thought.
These are technical data like HTML size, JS data volume, and so on.
🔒 The Technical report is part of PLUS tests.
Opportunities Report
In the tester interface, we also offer potential speed improvements for individual page types:
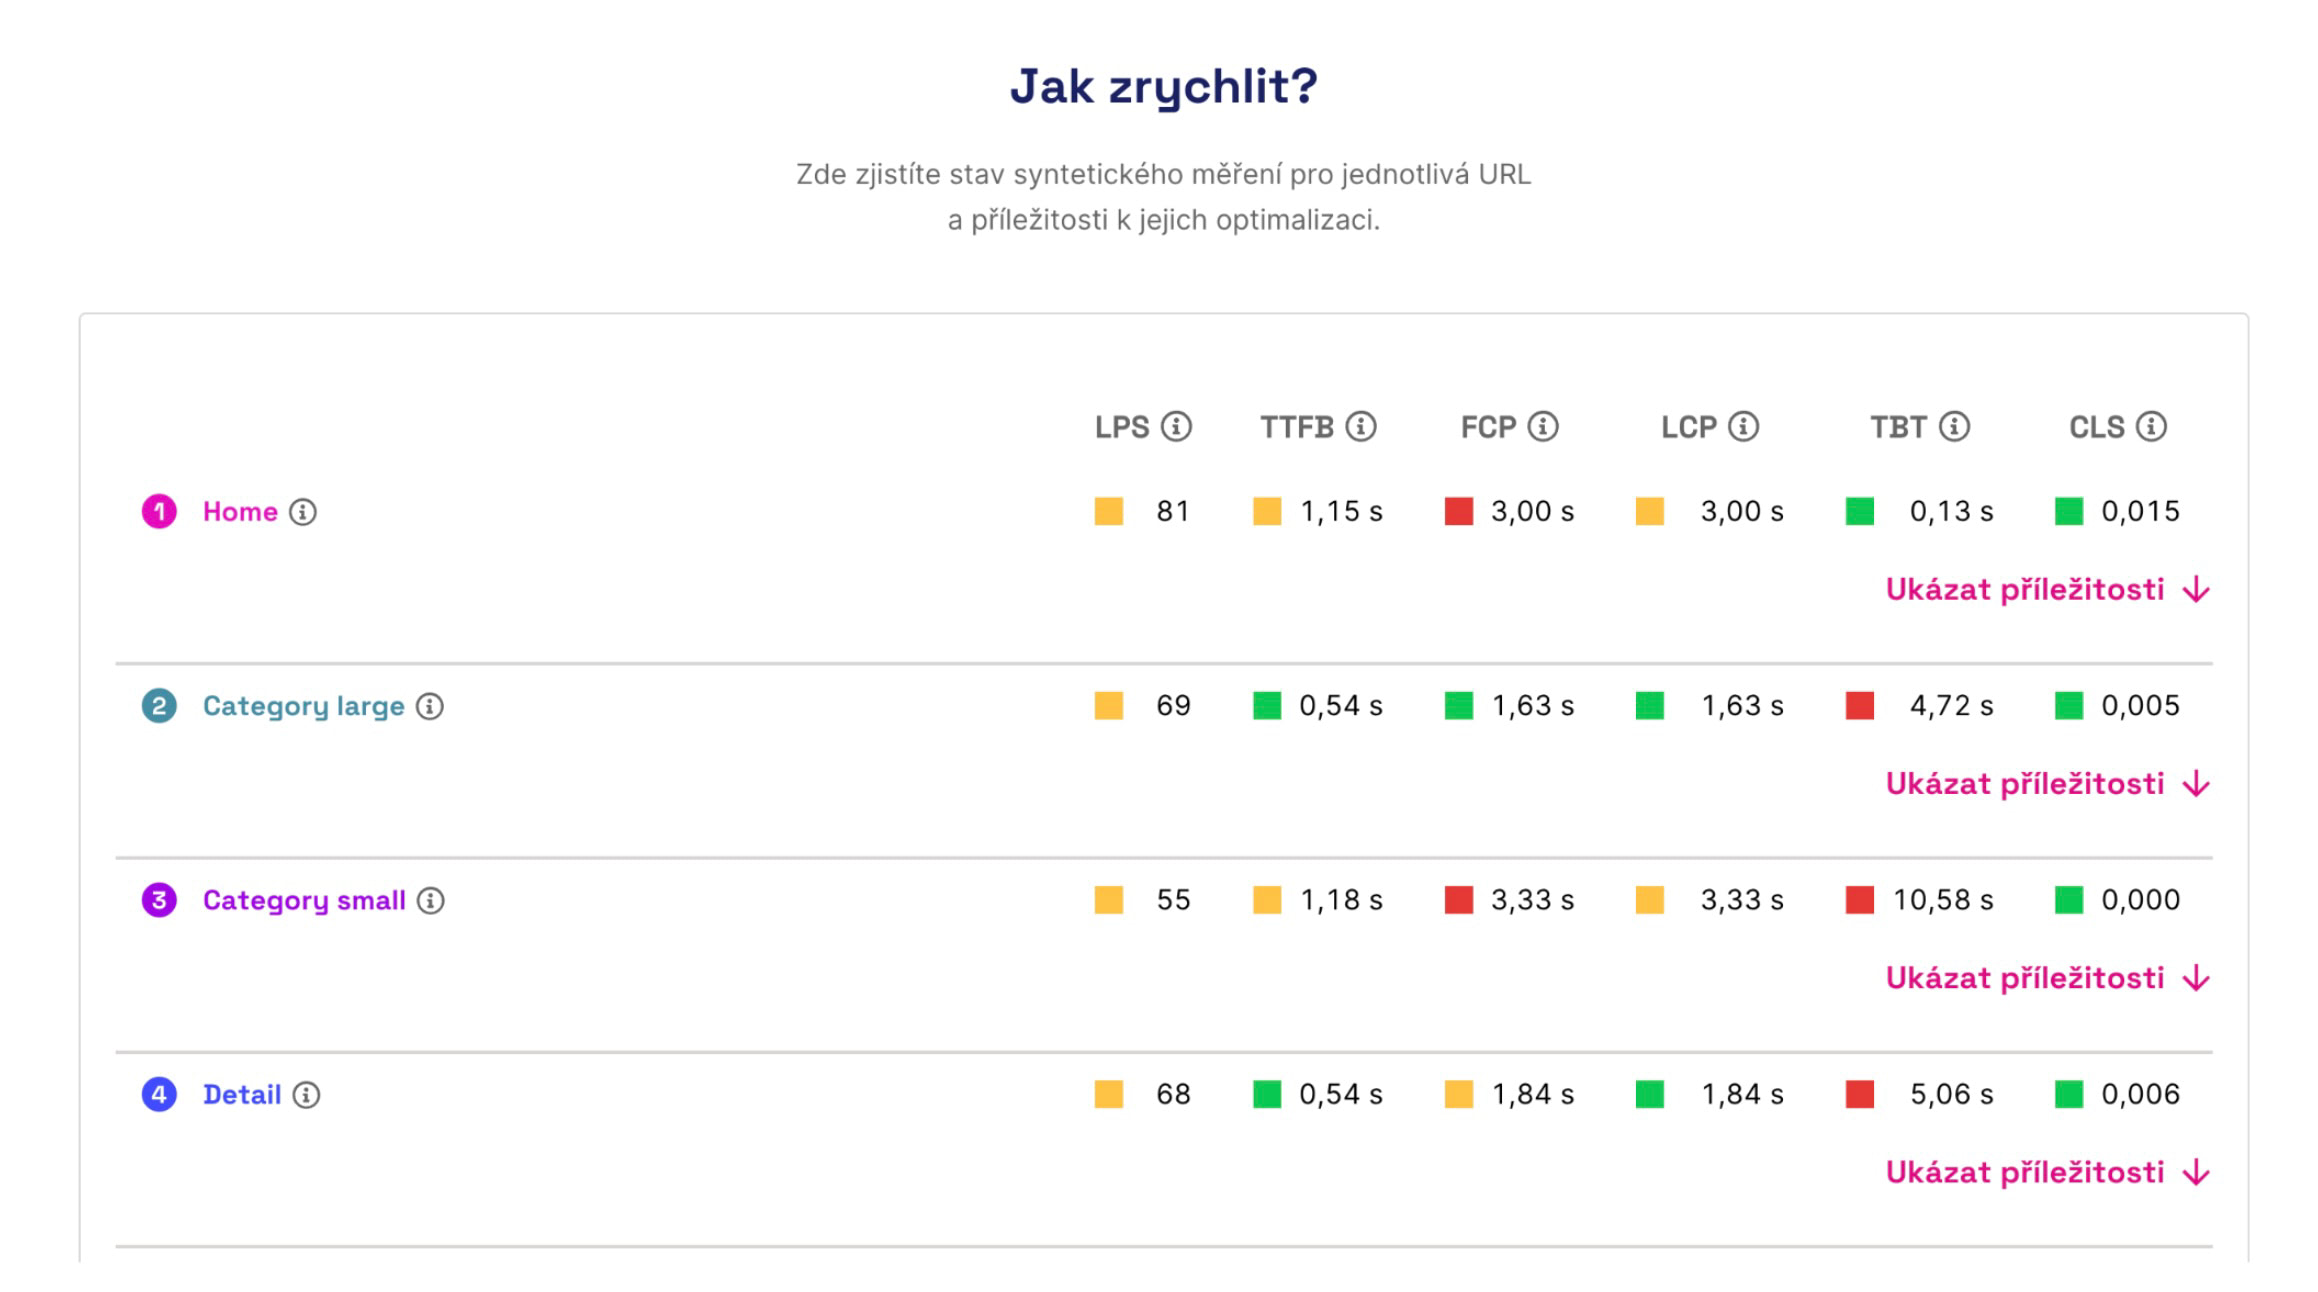
Check out the improvement opportunities for each measured URL.
🔒 The Opportunities report is part of PLUS tests, in the free version it only shows opportunities for the first measured URL.
These are currently opportunities from the Lighthouse tool, with plans to gradually add our own. The same can be found in the detailed view of a specific test after clicking on a point in the synthetic measurement graph.
Notes
Notes in graphs allow you to more easily evaluate the impact of changes you’ve made to the website. In some cases, we also insert notes automatically.
 Notes are visible in all graphs, ensuring you don’t miss potential impacts on any speed metrics.
Need Help? Got Feedback?
If you have feedback or questions, don’t hesitate to write to us at info@pagespeed.cz.
As part of our consultancy, we also offer optimization services, and we’ll be happy to help you with speed.