Testing Web Vitals in the Browser (A Key Skill for Developers)
Core Web Vitals are metrics we use to evaluate website performance in areas such as loading speed, interactivity, and layout stability. These metrics are increasingly important for ensuring a good user experience, and Google uses them as one of the criteria for search result rankings.
In our practice, we still encounter developers who lack the knowledge to reliably test Core Web Vitals in their browsers. It's not enough to make a change you think will improve the metrics. You must also test the impact of your adjustments.
We certainly don't recommend "blind" optimizations, using a trial-and-error method, like "launch it and wait for user data feedback."
Testing exclusively in Lighthouse isn't ideal, as it only performs synthetic measurements, meaning you won't get the INP metric and CLS is measured with limitations.
Testing Core Web Vitals in the browser complements regular automated web speed monitoring, which you should also have in place.
In this article, we’ll show you how to properly test your website.
What Are Core Web Vitals?
Repetition is the mother of wisdom. The basic Core Web Vitals metrics are three:
 Core Web Vitals in all their glory. These metrics need to be tested above all.
- Interaction to Next Paint (INP) – speed of loading the largest element.
- Largest Contentful Paint (LCP) – website response after user interactions.
- Cumulative Layout Shift (CLS) – layout stability.
Why Not Use Lighthouse in the Browser?
Lighthouse can help with speed tuning, but we generally have many reservations about it, so we don't recommend it for testing your metrics after development changes.
It doesn't measure user metrics but does so synthetically, like a machine, as explained in the differences between measurements. This brings another issue - the metrics it provides only apply to the first load and what happens in the first viewport (thus measuring CLS poorly, and INP not at all).
It's not ideal for measuring LCP either, as it can only test one context, such as a website with a cookie banner. Martin Michálek delves deeper into the pros and cons of the Lighthouse tool and its LPS metric in his article Lighthouse Performance Score (LPS): The Beauty and Traps of the Metric of All Metrics.
 The Lighthouse tool can help, but it’s not enough for testing in the browser.
How to Test Core Web Vitals in the Browser
The primary tool for our testing will be the developer tools ("Dev Tools") in the Google Chrome browser. They include additional, often well-hidden features that significantly ease our work.
Today, we’ll specifically discuss the Web Vitals extension for Chrome and the Performance panel.
Web Vitals Chrome Extension
The simplest way to test Web Vitals metrics is to open the Web Vitals extension in your browser. It displays metrics for any page you visit.
We recommend pinning the Web Vitals to your extensions bar, where it will always be handy. On the given page, simply click its icon, and on the next load, you’ll see a table with metrics.
 Web Vitals Extension.
In the extension settings, we also recommend checking the "Console logging" option. This allows you to debug advanced information about individual metrics directly in the Console tab in DevTools.
 Console logging details using the Core Web Vitals extension.
We use the Web Vitals Extension for testing all three metrics. An advantage is that you can slow down the network in the Network panel and measure metrics under simulated conditions.
Performance Panel
The Performance panel has a new look as of September 2024 and features two modes – metric status measurement and detailed measurement.
Metric Status in the Performance Panel
This mode allows for quick tests, similar to the Web Vitals extension.
 Metric status in the Performance panel for quick page testing and interaction.
Let's describe what’s visible in the image:
- Live metric status on the page, which changes during use, and comparison with Chrome UX Report data.
- Logging panel for interactions (for the INP metric) or layout shifts (for the CLS metric).
- Panel with options for Chrome UX Report data downloading.
- Testing parameters – we recommend setting at least 4 ⨉ CPU slowdown and slower 4G connection here.
- Recording detailed measurement – transition to a complete record of page loading or interaction. More on this below.
Detailed Measurement in the Performance Panel
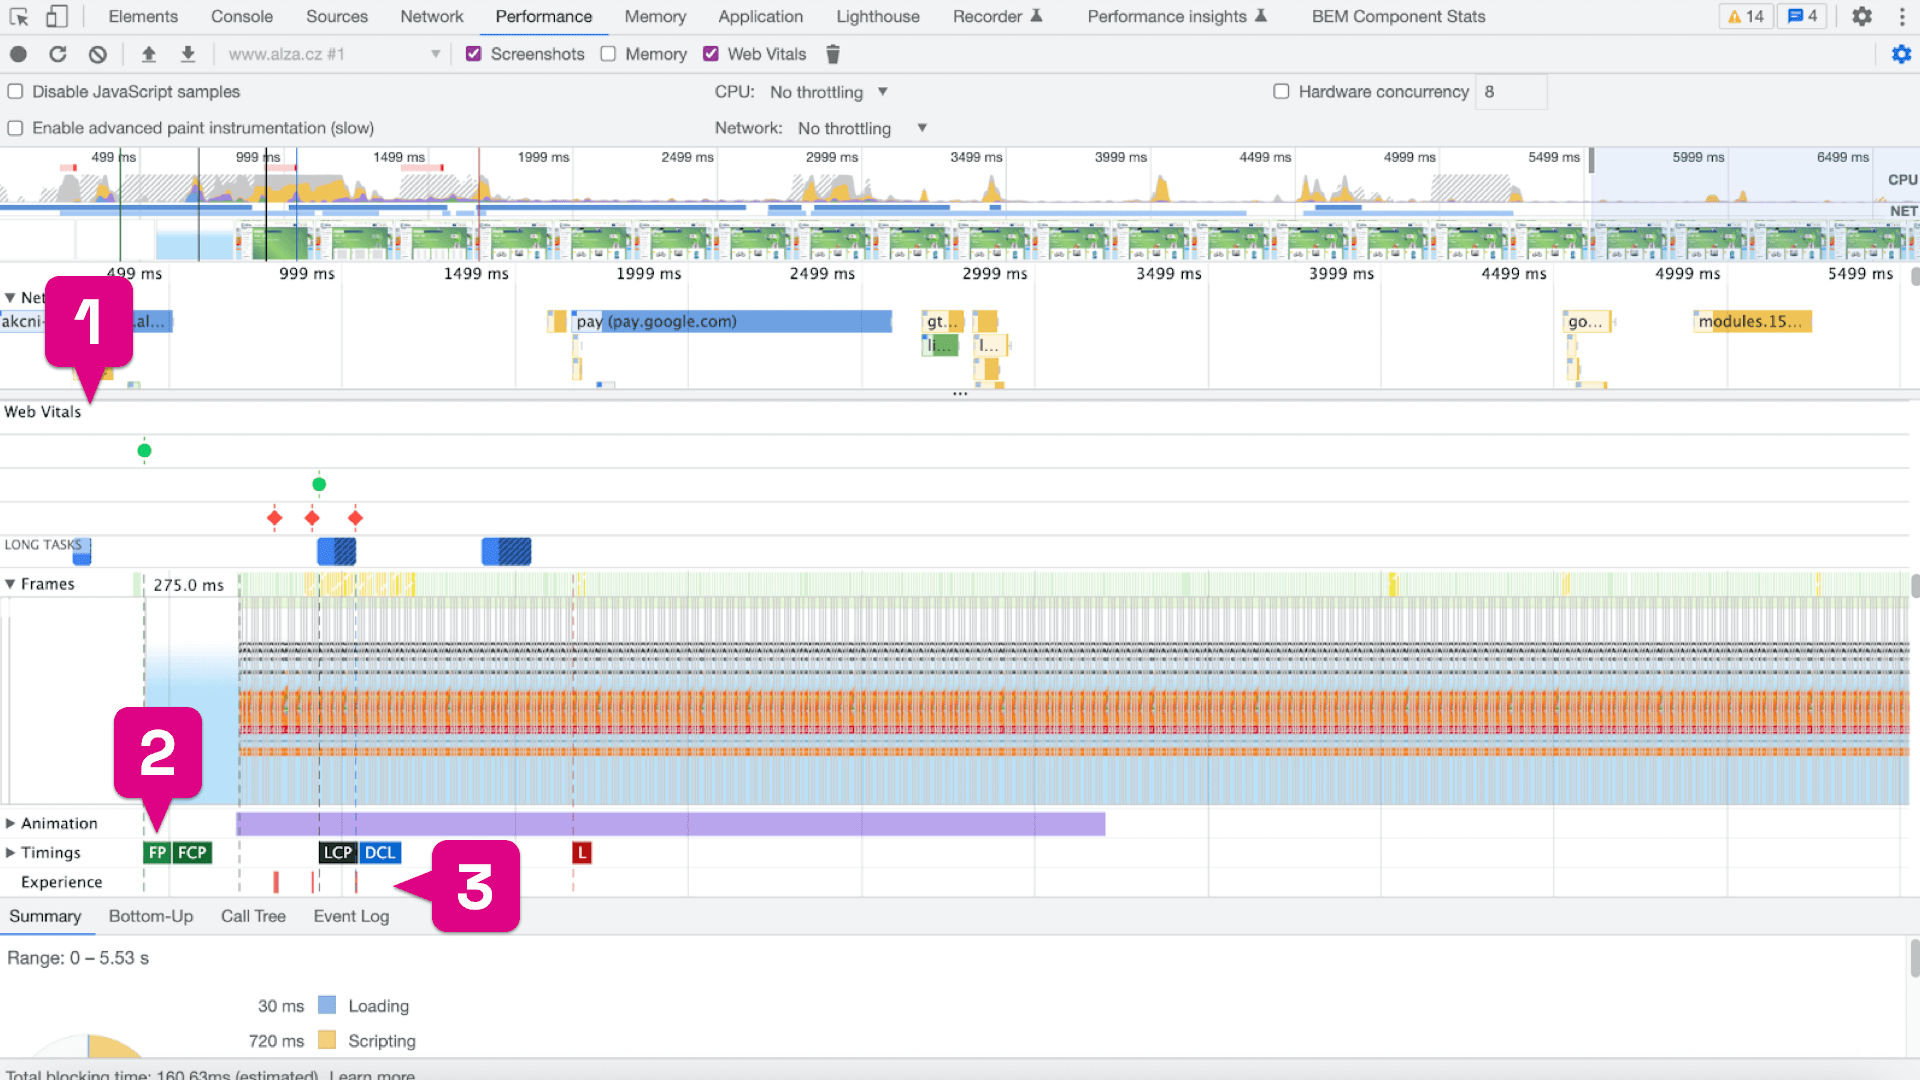
We affectionately call this tool "worms," due to the way it displays executed JavaScript. However, it contains many other useful tabs. For our needs, the most important sections are "Web Vitals" (number 1 in the image below), "Timings" (2), and "Experience" (3).

Web Vitals is the first section in the Performance panel that provides us with time data for the metrics.

The Timings section is quite similar, but in the case of the LCP metric, it includes valuable information, such as about the specific element, size, and type.

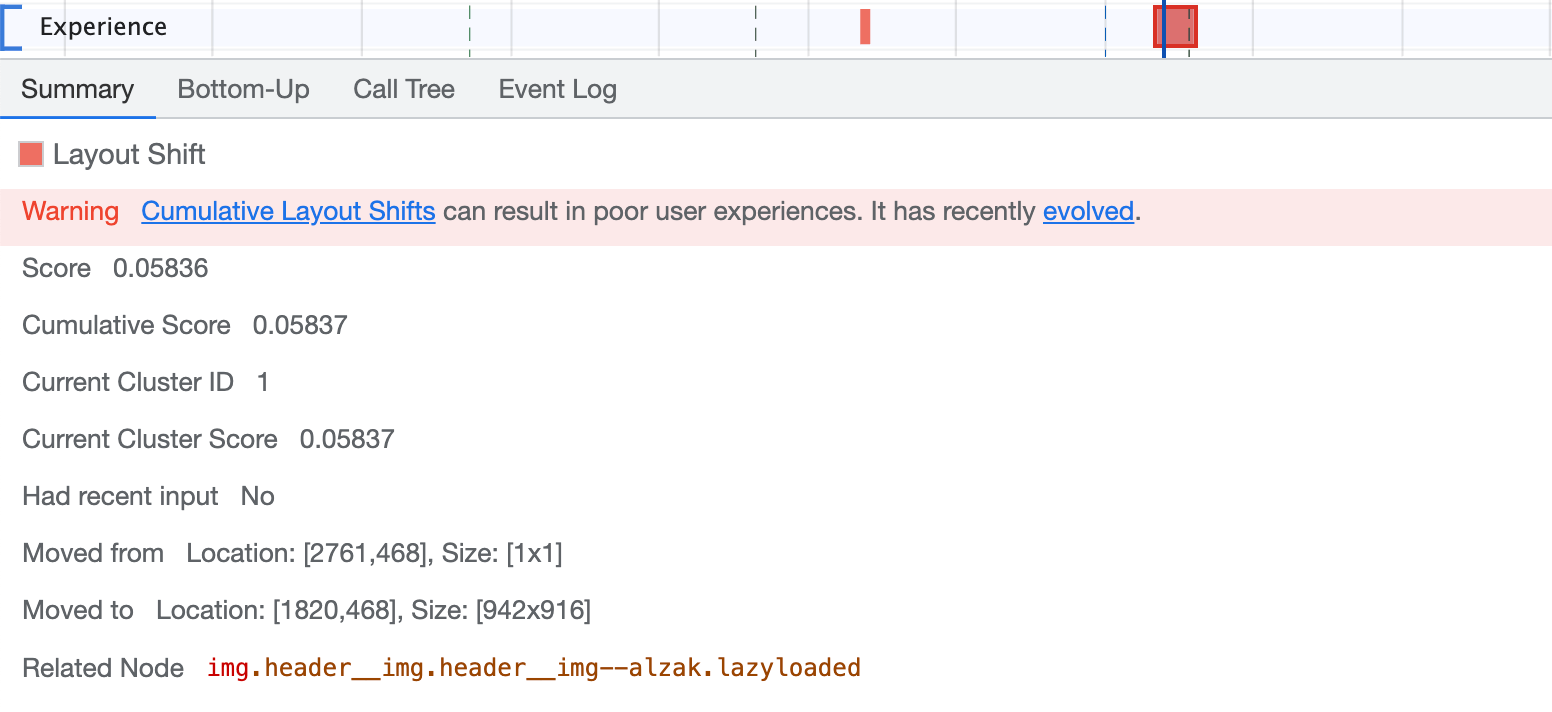
Conversely, the Experience section is most often used when testing the CLS metric, as it displays a detailed analysis of the measured layout shift on the page. Simply click into the red square marking the issue, and information will appear as shown below.

It's good to know that you can download the measurement record in Trace format from the Performance panel even from the test run detail of our PLUS monitoring.
Conclusion
Remember that optimizing Core Web Vitals metrics not only improves user experience on the web but any changes to improve metrics should always be tested.
Tags:Core Web Vitals
PreviousCLS: How to Maintain Height?NextINP and setTimeout()